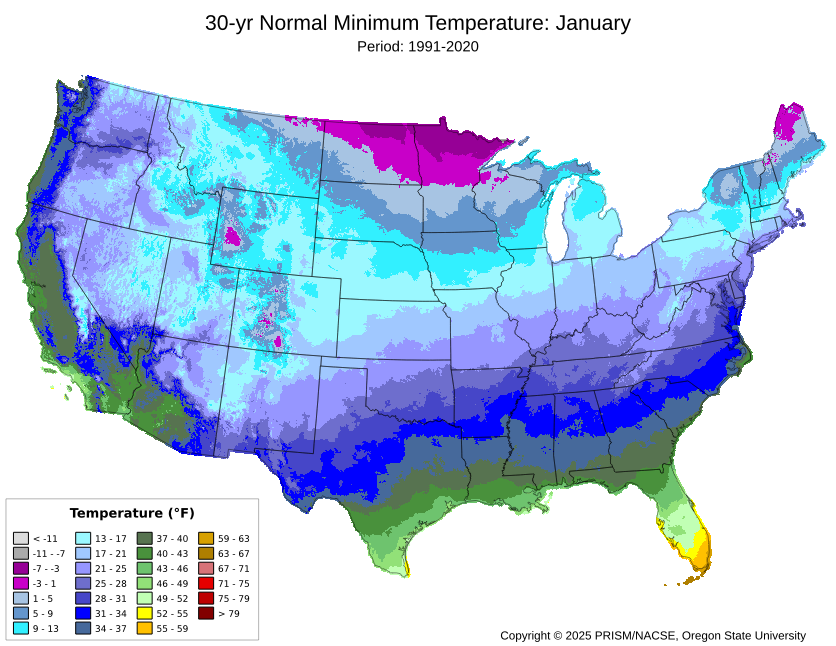
This information offers an "early glimpse" version of data from the current month, and should not be used for analyses that require completeness or accuracy. The information is based on whatever data is available from as many of the station networks and data sources possible, and changes as new data becomes available or as data quality is improved. See PRISM datasets for more information; data available from this page is type "AN" (daily). Individual grids may contain inhomogeneities due to station equipment and location changes and to station openings/closings. For information on when the grids were most recently updated, see calendar of PRISM data updates.
These datasets should be considered "early" (certain to change as new reporting stations are added and quality control measures are applied).
Any known issues with the PRISM time series datasets are documented in the Known Issues section.
| Download size: | approx. 1-27MB per data file; 300KB per full-size image | |||
| Variable: | precipitation | mean temperature | minimum temperature | maximum temperature |
| mean dew point temperature | minimum vapor pressure deficit | maximum vapor pressure deficit | ||
| Temporal period: | month-to-date (September 1-12) | |||
| specific day September | ||||
| deviation from 30-year normals (available for precipitation and mean temperature only) | ||||
| Download Full-Size Image | Download All Data for Month (.bil) | ||
| Jump to the Daily Map Graphics Generator | View/Download Metadata | ||
| Data formats Terms of use Bulk downloads |
|||

